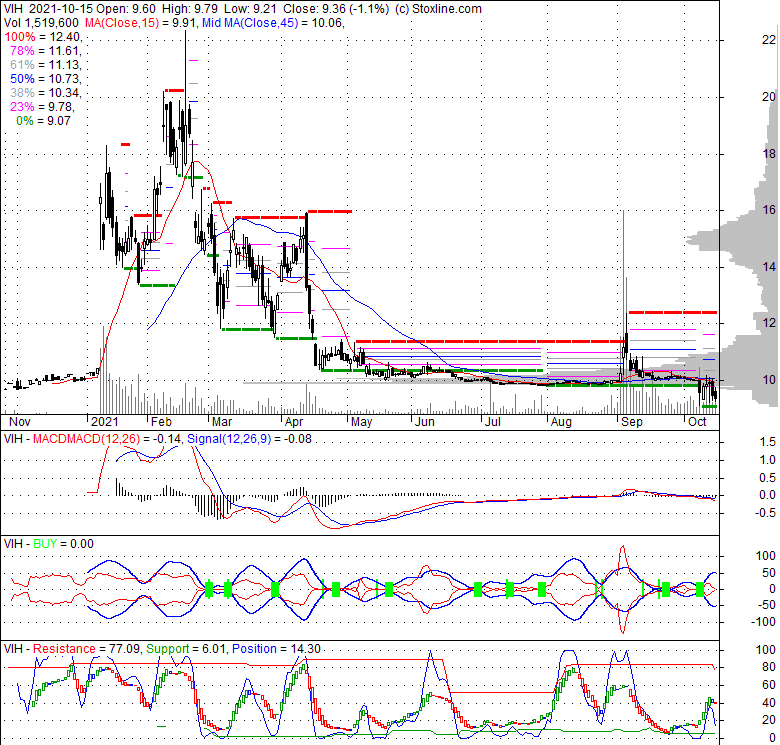
| 9.36 0 (0%) | 10-18 00:00 | |||||||||||||
|
|
| Short term | |
|||
| Mid term | |
|||
| Targets | 6-month : | 1-year : | ||
| Resists | First : | Second : | ||
| Pivot price | ||||
| Supports | First : | Second : | ||
| MAs | MA(5) : | MA(20) : | ||
| MA(100) : | MA(250) : | |||
| MACD | MACD : | Signal : | ||
| %K %D | K(14,3) : | D(3) : | ||
| RSI | RSI(14): | |||
| 52-week | High : | Low : | ||
| If tomorrow: | Open lower | Open higher |
| High: | - | - |
| Low: | - | - |
| Close: | - | - |
VPC Impact Acquisition Holdings focuses on effecting a merger, share exchange, asset acquisition, share purchase, reorganization or similar business combination with one or more businesses or entities. The company was founded in 2020 and is based in Chicago, Illinois.
Mon, 20 Jun 2022
SHAREHOLDER ALERT: Pomerantz Law Firm Reminds Shareholders with Losses on their Investment in Bakkt ... - PR Newswire
Wed, 05 Jan 2022
Dave and VPC Impact Acquisition Holdings III, Inc. Announce Closing of Business Combination - GlobeNewswire
Fri, 12 Nov 2021
Crypto And Digital Asset Platform Bakkt Releases First Earnings, Lays Out Bold Partnership Strategy To Growth - Forbes
Mon, 18 Oct 2021
Bakkt Completes Business Combination with VPC Impact Acquisition Holdings - Coinspeaker
Fri, 15 Oct 2021
ICE Announces Completion of Merger Between Bakkt and VPC Impact Acquisition Holdings - Business Wire
Fri, 15 Oct 2021
Bakkt Closes Business Combination with VPC Impact Acquisition Holdings and Will Begin Trading on the New York ... - Business Wire
| Price to Book Value: P/BV, a ratio used to compare book value to its current market price, to gauge whether a stock is valued properly. |
Outperform |
| Price to Earnings: PE, the ratio for valuing a company that measures its current share price relative to its earnings per share (EPS). |
Underperform |
| Discounted cash flow: DCF, a valuation method used to estimate the value of an investment based on its expected future cash flows. |
Outperform |
| Return on Assets: ROA, indicates how profitable a company is in relation to its total assets, how efficiently uses assets to generate a profit. |
Neutral |
| Return on Equity: ROE, a measure of financial performance calculated by dividing net income by equity. a gauge of profitability and efficiency. |
Neutral |
| Debt to Equity: evaluate financial leverage, reflects the ability of equity to cover outstanding debts in the event of a business downturn. |
Neutral |
|
Exchange:
NASDAQ
|
|
|
Sector:
Financial Services
|
|
|
Industry:
Shell Companies
|
|
| Shares Out | 0 (M) |
| Shares Float | 0 (M) |
| Held by Insiders | (%) |
| Held by Institutions | (%) |
| Shares Short | 0 (K) |
| Shares Short P.Month | 0 (K) |
| EPS | |
| EPS Est Next Qtrly | |
| EPS Est This Year | |
| EPS Est Next Year | |
| Book Value (p.s.) | |
| Profit Margin | % |
| Operating Margin | % |
| Return on Assets (ttm) | % |
| Return on Equity (ttm) | % |
| Qtrly Rev. Growth | % |
| Gross Profit (p.s.) | |
| Sales Per Share | |
| EBITDA (p.s.) | |
| Qtrly Earnings Growth | % |
| Operating Cash Flow | 0 (M) |
| Levered Free Cash Flow | 0 (M) |
| PE Ratio | |
| PEG Ratio | |
| Price to Book value | |
| Price to Sales | |
| Price to Cash Flow |
| Dividend | |
| Forward Dividend | |
| Dividend Yield | 0% |
| Dividend Pay Date | |
| Ex-Dividend Date |

|

|
|

|
|
|
|
|
|