| 0.4 -0.06 (-13.04%) | 04-04 16:00 | |||||||||||||
|
|
| Short term | ||||
| Mid term | ||||
| Targets | 6-month : | 12.05 |
1-year : | 19.27 |
| Resists | First : | 10.31 |
Second : | 16.5 |
| Pivot price | 5.45 |
|||
| Supports | First : | 0.31 |
Second : | 0.26 |
| MAs | MA(5) : | 11.35 |
MA(20) : | 4.18 |
| MA(100) : | 1.13 |
MA(250) : | 0 | |
| MACD | MACD : | 2.5 |
Signal : | 2 |
| %K %D | K(14,3) : | 60.5 |
D(3) : | 79.5 |
| RSI | RSI(14): 41.9 |
|||
| 52-week | High : | 16.5 | Low : | 0.2 |
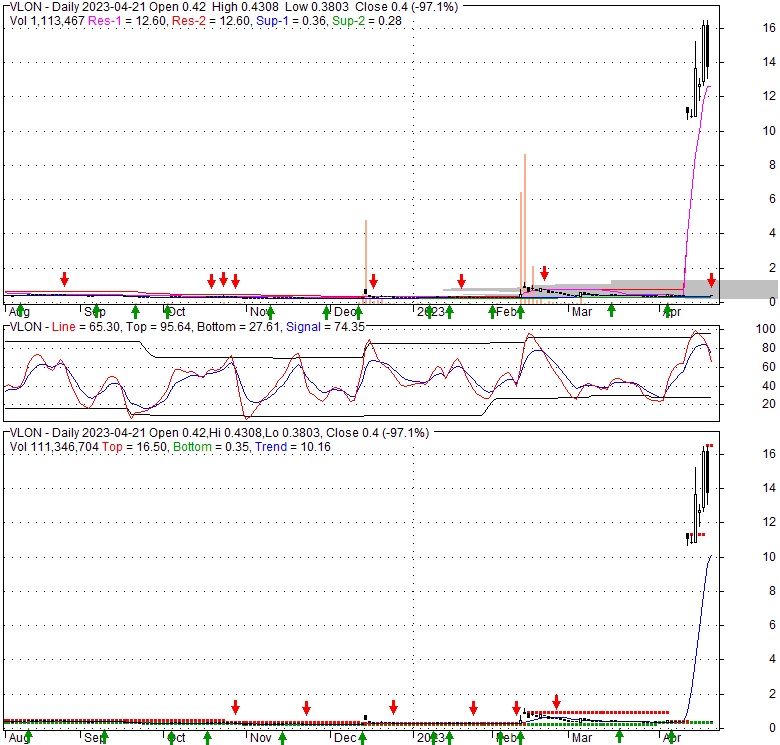
Price has closed below its short-term moving average. Short-term moving average is currently above mid-term; and above long-term moving average. From the relationship between price and moving averages: This stock is NEUTRAL in short-term; and BULLISH in mid-long term.[ VLON ] has closed above bottom band by 30.0%. Bollinger Bands are 1443.8% wider than normal. The large width of the bands suggest high volatility as compared to its normal range. The bands have been in this wide range for 6 days. This is a sign that the current trend might continue.
| If tomorrow: | Open lower | Open higher |
| High: | 0.43 - 0.43 | 0.43 - 0.44 |
| Low: | 0.37 - 0.38 | 0.38 - 0.38 |
| Close: | 0.4 - 0.4 | 0.4 - 0.4 |
Vallon Pharmaceuticals, Inc., a biopharmaceutical company, focuses on the development and commercialization of novel medications for central nervous system disorders with a focus on abuse-deterrent medications. Its lead investigational product candidate is ADAIR, an abuse-deterrent oral formulation of immediate-release dextroamphetamine for the treatment of attention-deficit/hyperactivity disorder (ADHD) and narcolepsy. The company is also developing ADMIR, an abuse deterrent formulation of methylphenidate for the treatment of ADHD. Vallon Pharmaceuticals, Inc. was incorporated in 2018 and is based in Philadelphia, Pennsylvania.
Fri, 21 Apr 2023
Vallon Pharmaceuticals Completes Merger with GRI Bio, Inc. - GlobeNewswire
Thu, 20 Apr 2023
Vallon Pharmaceuticals Announces Stockholder Approval of Merger with GRI Bio, Inc. and Reverse Stock Split - GlobeNewswire
Fri, 17 Feb 2023
4 Cheap Robinhood Stocks Under $1 To Watch Trading For Pennies - Penny Stocks
Tue, 13 Dec 2022
Vallon Pharmaceuticals and GRI Bio Enter into Merger Agreement with Goal of Advancing Innovative Pipeline of NKT ... - GlobeNewswire
Thu, 12 May 2022
Vallon Pharmaceuticals Reports Additional Pharmacokinetic and Pharmacodynamic Data from SEAL Study of ADAIR - GlobeNewswire
Fri, 22 Apr 2022
Vallon Pharmaceuticals Announces Review of Strategic Alternatives - GlobeNewswire
| Price to Book Value: P/BV, a ratio used to compare book value to its current market price, to gauge whether a stock is valued properly. |
Outperform |
| Price to Earnings: PE, the ratio for valuing a company that measures its current share price relative to its earnings per share (EPS). |
Underperform |
| Discounted cash flow: DCF, a valuation method used to estimate the value of an investment based on its expected future cash flows. |
Neutral |
| Return on Assets: ROA, indicates how profitable a company is in relation to its total assets, how efficiently uses assets to generate a profit. |
Underperform |
| Return on Equity: ROE, a measure of financial performance calculated by dividing net income by equity. a gauge of profitability and efficiency. |
Underperform |
| Debt to Equity: evaluate financial leverage, reflects the ability of equity to cover outstanding debts in the event of a business downturn. |
Underperform |
|
Exchange:
NASDAQ
|
|
|
Sector:
Healthcare
|
|
|
Industry:
Biotechnology
|
|
| Shares Out | 13 (M) |
| Shares Float | 9 (M) |
| Held by Insiders | 23.4 (%) |
| Held by Institutions | 13.2 (%) |
| Shares Short | 91 (K) |
| Shares Short P.Month | 1,130 (K) |
| EPS | -15.36 |
| EPS Est Next Qtrly | 0 |
| EPS Est This Year | 0 |
| EPS Est Next Year | 0 |
| Book Value (p.s.) | 0.17 |
| Profit Margin | 0 % |
| Operating Margin | 0 % |
| Return on Assets (ttm) | -69.4 % |
| Return on Equity (ttm) | -172.2 % |
| Qtrly Rev. Growth | 0 % |
| Gross Profit (p.s.) | 0 |
| Sales Per Share | 0 |
| EBITDA (p.s.) | -0.5 |
| Qtrly Earnings Growth | 0 % |
| Operating Cash Flow | -7 (M) |
| Levered Free Cash Flow | -4 (M) |
| PE Ratio | -0.03 |
| PEG Ratio | 0 |
| Price to Book value | 2.35 |
| Price to Sales | 0 |
| Price to Cash Flow | -0.76 |
| Dividend | 0 |
| Forward Dividend | 0 |
| Dividend Yield | 0% |
| Dividend Pay Date | Invalid DateTime. |
| Ex-Dividend Date | Invalid DateTime. |

|

|
|

|
|
|
|
|
|