| 0.8355 -0.275 (-24.73%) | 11-03 16:00 | |||||||||||||
|
|
| Short term | ||||
| Mid term | |
|||
| Targets | 6-month : | 0.75 |
1-year : | 1.21 |
| Resists | First : | 0.64 |
Second : | 1.03 |
| Pivot price | 0.36 |
|||
| Supports | First : | 0 | Second : | 0 |
| MAs | MA(5) : | 0.26 |
MA(20) : | 0.35 |
| MA(100) : | 2.31 |
MA(250) : | 18.04 |
|
| MACD | MACD : | -0.3 |
Signal : | -0.3 |
| %K %D | K(14,3) : | 29.7 |
D(3) : | 30.5 |
| RSI | RSI(14): 39.4 |
|||
| 52-week | High : | 94.33 | Low : | 0 |
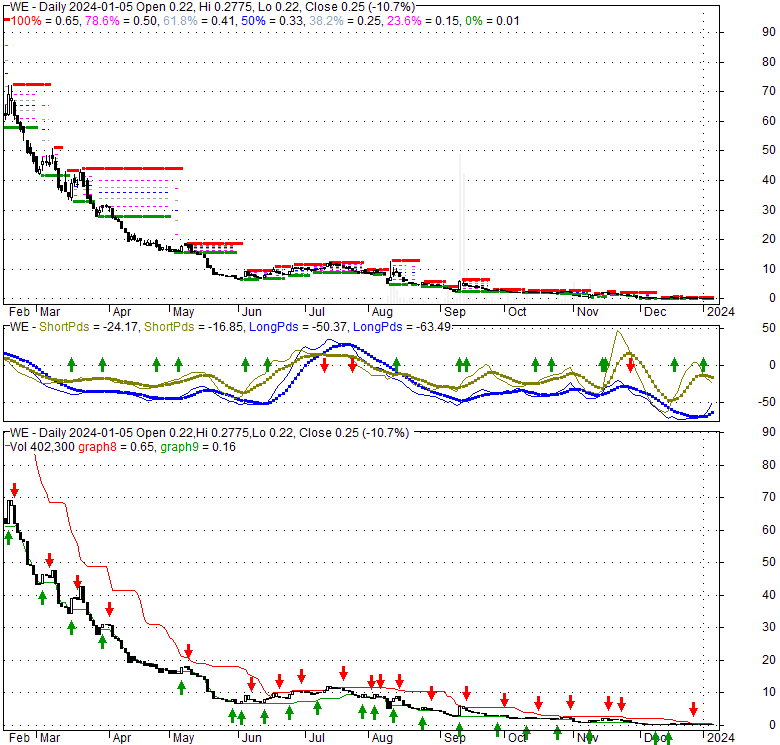
Price has closed below its short-term moving average. Short-term moving average is currently below mid-term; and below long-term moving average. From the relationship between price and moving averages: This stock is BEARISH in short-term; and BEARISH in mid-long term.[ WE ] has closed above bottom band by 26.6%. Bollinger Bands are 79.5% narrower than normal. The narrow width of the bands suggests low volatility as compared to its normal range. The bands have been in this narrow range for 15 bars. This is a sign that the market may be about to initiate a new trend.
| If tomorrow: | Open lower | Open higher |
| High: | 0.28 - 0.28 | 0.28 - 0.28 |
| Low: | 0.22 - 0.22 | 0.22 - 0.22 |
| Close: | 0.25 - 0.25 | 0.25 - 0.25 |
WeWork Inc. provides flexible workspace solutions to individuals and organizations worldwide. The company offers workstation, private office, and customized floor solutions; and various amenities and services, such as private phone booths, internet, high-speed business printers and copiers, mail and package handling, front desk services, off-peak building access, common areas, and daily enhanced cleaning solutions. It also offers various value-add services; business and technical service solutions, including professional employer organization and payroll services, remote workforce solutions, human resources benefits, dedicated bandwidth, and IT equipment co-location solutions. In addition, the company offers workspace management solutions, which enable landlords and operators to power flexible spaces and provide direct access to an established customer base. As of December 31, 2021, its real estate portfolio includes 756 locations. WeWork Inc. was founded in 2010 and is headquartered in New York, New York.
Thu, 18 Apr 2024
Founder Neumann accelerates efforts to buy back WeWork - Proactive Investors USA
Thu, 18 Apr 2024
WeWork Inc. (NYSE:WE) Just Reported, And Analysts Assigned A US$3.38 Price Target - Yahoo Movies UK
Tue, 19 Dec 2023
SHAREHOLDER ALERT: Levi & Korsinsky, LLP Announces an Investigation of Wework, Inc. - PR Newswire
Wed, 15 Nov 2023
WeWork's Rescue Wasn't Real - Bloomberg
Mon, 06 Nov 2023
WeWork Takes Strategic Action to Significantly Strengthen Balance Sheet and Further Streamline Real Estate Footprint - Business Wire
Mon, 06 Nov 2023
WeWork stock still halted for news, with no release or comment from the company - MarketWatch
| Price to Book Value: P/BV, a ratio used to compare book value to its current market price, to gauge whether a stock is valued properly. |
Underperform |
| Price to Earnings: PE, the ratio for valuing a company that measures its current share price relative to its earnings per share (EPS). |
Underperform |
| Discounted cash flow: DCF, a valuation method used to estimate the value of an investment based on its expected future cash flows. |
Neutral |
| Return on Assets: ROA, indicates how profitable a company is in relation to its total assets, how efficiently uses assets to generate a profit. |
Underperform |
| Return on Equity: ROE, a measure of financial performance calculated by dividing net income by equity. a gauge of profitability and efficiency. |
Outperform |
| Debt to Equity: evaluate financial leverage, reflects the ability of equity to cover outstanding debts in the event of a business downturn. |
Underperform |

|
Exchange:
NYSE
|
|
|
Sector:
Real Estate
|
|
|
Industry:
Real Estate - Services
|
|
| Shares Out | 53 (M) |
| Shares Float | 15 (M) |
| Held by Insiders | 0 (%) |
| Held by Institutions | 0 (%) |
| Shares Short | 4,750 (K) |
| Shares Short P.Month | 3,720 (K) |
| EPS | -74 |
| EPS Est Next Qtrly | 0 |
| EPS Est This Year | 0 |
| EPS Est Next Year | 0 |
| Book Value (p.s.) | -70.49 |
| Profit Margin | -48.7 % |
| Operating Margin | -23.2 % |
| Return on Assets (ttm) | -3.1 % |
| Return on Equity (ttm) | 0 % |
| Qtrly Rev. Growth | 3.5 % |
| Gross Profit (p.s.) | 50.03 |
| Sales Per Share | 63.68 |
| EBITDA (p.s.) | -4.35 |
| Qtrly Earnings Growth | 0 % |
| Operating Cash Flow | -728 (M) |
| Levered Free Cash Flow | -336 (M) |
| PE Ratio | -0.01 |
| PEG Ratio | 0 |
| Price to Book value | -0.01 |
| Price to Sales | 0 |
| Price to Cash Flow | -0.02 |
| Dividend | 0 |
| Forward Dividend | 0 |
| Dividend Yield | 0% |
| Dividend Pay Date | Invalid DateTime. |
| Ex-Dividend Date | Invalid DateTime. |