
| 6.98 0.003 (0.04%) | 10-19 16:00 | |||||||||||||
|
|
| Short term |  |
|||
| Mid term | |
|||
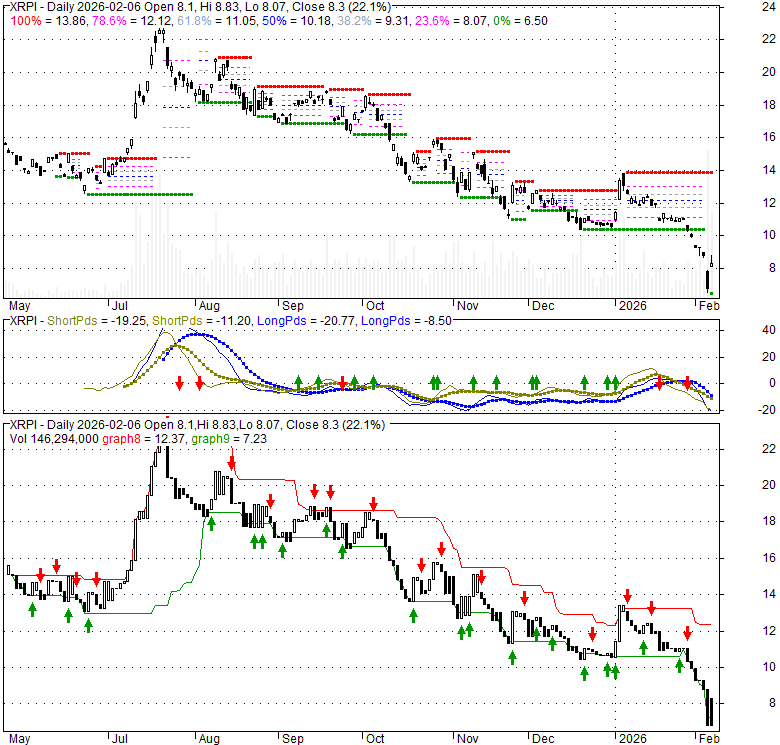
| Targets | 6-month : | 9.31 | 1-year : | 10.18 |
| Resists | First : | 7.97 | Second : | 8.71 |
| Pivot price | 7.58  |
|||
| Supports | First : | 6.76 | Second : | 5.63 |
| MAs | MA(5) : | 7.13 |
MA(20) : | 7.76 |
| MA(100) : | 6.72 |
MA(250) : | 8.61 |
|
| MACD | MACD : | -0.2 |
Signal : | 0 |
| %K %D | K(14,3) : | 9.1  |
D(3) : | 9.9 |
| RSI | RSI(14): 40.1 |
|||
| 52-week | High : | 15.7 | Low : | 5.4 |
Price has closed below its short-term moving average. Short-term moving average is currently below mid-term; and above long-term moving average. From the relationship between price and moving averages: This stock is BEARISH in short-term; and NEUTRAL in mid-long term.[ XRPI ] has closed above bottom band by 13.0%. Bollinger Bands are 5.6% wider than normal. The current width of the bands does not suggest anything about the future direction or movement of prices.
| If tomorrow: | Open lower | Open higher |
| High: | 7.05 - 7.08 | 7.08 - 7.11 |
| Low: | 6.86 - 6.9 | 6.9 - 6.93 |
| Close: | 6.92 - 6.98 | 6.98 - 7.03 |
XRPI is an actively managed investment vehicle designed to generate returns correlated with XRP futures contracts. These futures are traded on exchanges regulated by the CFTC, and the fund also holds supporting assets such as cash or top-tier securities. Its strategy involves seeking full exposure to XRP's performance by focusing on near-term XRP futures and systematically rolling these contracts forward before they mature. While it does not directly acquire XRP tokens, the fund profits from increases in the price of XRP futures contracts, though investors are fully exposed to potential losses. For context, the underlying XRP cryptocurrency primarily serves as a medium for streamlining international transactions and payments via the Ripple network. Beyond futures, the fund's portfolio may encompass shares in other XRP-linked Exchange Traded Products (ETPs) not registered under the 1940 Act (where permitted), indices tied to XRP, and swap agreements linked to XRP's price. Structurally, the fund employs a subsidiary domiciled in the Cayman Islands for its futures contract investments.
Wed, 23 Sep 2026
XRP ETF declares monthly distribution of $0.0144 - TradingView
Mon, 14 Sep 2026
Institutional Money Is Pouring Into These 2 Altcoin ETFs - MarketBeat
Mon, 07 Sep 2026
Seven XRP ETFs Now Trade in the US: Key Details on Tickers and Structures - KuCoin
Thu, 16 Jul 2026
SEC filing shows viral $71 million XRP ETF claims are out by 1,000x - CryptoSlate
Thu, 16 Jul 2026
SEC filing shows viral $71 million XRP ETF claims are out by 1,000x - CryptoRank
Tue, 07 Apr 2026
XRPI: XRP Exposure With Yield, But Structural Disadvantages Remain - Seeking Alpha
| Price to Book Value: P/BV, a ratio used to compare book value to its current market price, to gauge whether a stock is valued properly. |
Neutral |
| Price to Earnings: PE, the ratio for valuing a company that measures its current share price relative to its earnings per share (EPS). |
Neutral |
| Discounted cash flow: DCF, a valuation method used to estimate the value of an investment based on its expected future cash flows. |
Neutral |
| Return on Assets: ROA, indicates how profitable a company is in relation to its total assets, how efficiently uses assets to generate a profit. |
Neutral |
| Return on Equity: ROE, a measure of financial performance calculated by dividing net income by equity. a gauge of profitability and efficiency. |
Neutral |
| Debt to Equity: evaluate financial leverage, reflects the ability of equity to cover outstanding debts in the event of a business downturn. |
Neutral |
|
Exchange:
NASDAQ
|
|
|
Sector:
Financial Services
|
|
|
Industry:
Asset Management - Cryptocurrency
|
|
| Shares Out | 0 (M) |
| Shares Float | 0 (M) |
| Held by Insiders | 0 (%) |
| Held by Institutions | 0 (%) |
| Shares Short | 0 (K) |
| Shares Short P.Month | 0 (K) |
| EPS | 0 |
| EPS Est Next Qtrly | 0 |
| EPS Est This Year | 0 |
| EPS Est Next Year | 0 |
| Book Value (p.s.) | 0 |
| Profit Margin | 0 % |
| Operating Margin | 0 % |
| Return on Assets (ttm) | 0 % |
| Return on Equity (ttm) | 0 % |
| Qtrly Rev. Growth | 0 % |
| Gross Profit (p.s.) | 0 |
| Sales Per Share | 0 |
| EBITDA (p.s.) | 0 |
| Qtrly Earnings Growth | 0 % |
| Operating Cash Flow | 0 (M) |
| Levered Free Cash Flow | 0 (M) |
| PE Ratio | 0 |
| PEG Ratio | 0 |
| Price to Book value | 0 |
| Price to Sales | 0 |
| Price to Cash Flow | 0 |
| Dividend | 0 |
| Forward Dividend | 0 |
| Dividend Yield | 0% |
| Dividend Pay Date | Invalid DateTime. |
| Ex-Dividend Date | Invalid DateTime. |

|

|

|

|
|
|
|
|
|