| 22.6968 -0.118 (-0.52%) | 04-25 15:50 | |||||||||||||
|
|
| Short term | ||||
| Mid term | |
|||
| Targets | 6-month : | 26.77 | 1-year : | 27.12 |
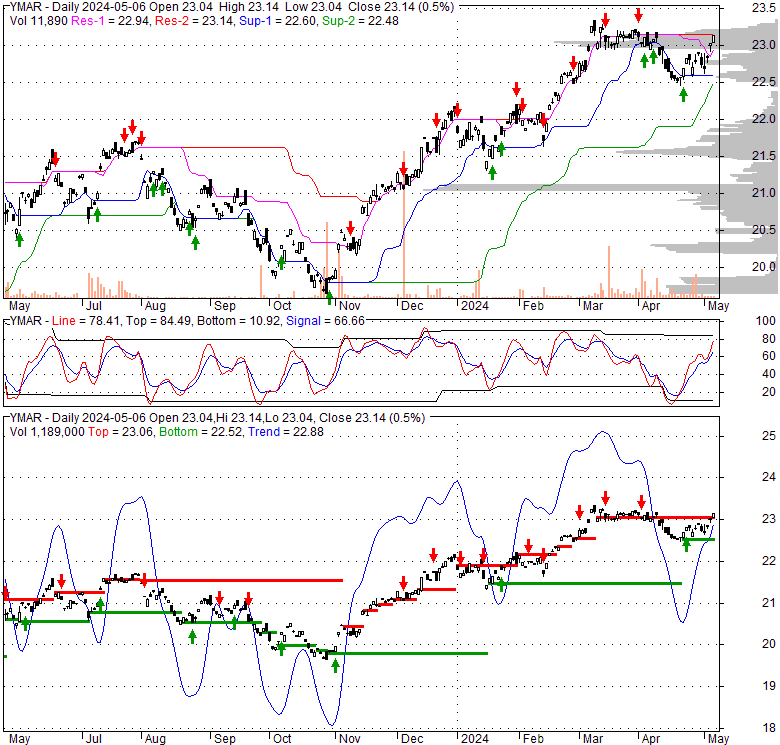
| Resists | First : | 22.92 | Second : | 23.21 |
| Pivot price | 22.77 |
|||
| Supports | First : | 22.44 | Second : | 18.67 |
| MAs | MA(5) : | 22.71 |
MA(20) : | 22.85 |
| MA(100) : | 22.28 |
MA(250) : | 21.4 |
|
| MACD | MACD : | -0.1 |
Signal : | -0.1 |
| %K %D | K(14,3) : | 44.9 |
D(3) : | 40.8 |
| RSI | RSI(14): 44.9 |
|||
| 52-week | High : | 23.35 | Low : | 19.64 |
Price has closed below its short-term moving average. Short-term moving average is currently below mid-term; and above long-term moving average. From the relationship between price and moving averages: This stock is BEARISH in short-term; and NEUTRAL in mid-long term.[ YMAR ] has closed above bottom band by 40.1%. Bollinger Bands are 4.9% wider than normal. The current width of the bands does not suggest anything about the future direction or movement of prices.
| If tomorrow: | Open lower | Open higher |
| High: | 22.79 - 22.92 | 22.92 - 23.02 |
| Low: | 22.26 - 22.41 | 22.41 - 22.55 |
| Close: | 22.46 - 22.7 | 22.7 - 22.9 |
Under normal market conditions, the fund will invest substantially all of its assets in FLexible EXchange® Options ("FLEX Options") that reference the price performance of the iShares MSCI EAFE ETF (the "underlying ETF"). FLEX Options are customized equity or index option contracts that trade on an exchange, but provide investors with the ability to customize key contract terms like exercise prices, styles and expiration dates. It is non-diversified.
Fri, 12 Apr 2024
Raymond James Financial Services Advisors Inc. Purchases 26508 Shares of FT Vest International Equity Moderate ... - Defense World
Wed, 10 Apr 2024
Arkadios Wealth Advisors Sells 2726 Shares of FT Vest International Equity Moderate Buffer ETF – March (BATS:YMAR) - Defense World
Fri, 22 Mar 2024
This Week in ETFs: iShares Debuts Energy Storage Fund - ETFdb.com
| Price to Book Value: P/BV, a ratio used to compare book value to its current market price, to gauge whether a stock is valued properly. |
Neutral |
| Price to Earnings: PE, the ratio for valuing a company that measures its current share price relative to its earnings per share (EPS). |
Neutral |
| Discounted cash flow: DCF, a valuation method used to estimate the value of an investment based on its expected future cash flows. |
Neutral |
| Return on Assets: ROA, indicates how profitable a company is in relation to its total assets, how efficiently uses assets to generate a profit. |
Neutral |
| Return on Equity: ROE, a measure of financial performance calculated by dividing net income by equity. a gauge of profitability and efficiency. |
Neutral |
| Debt to Equity: evaluate financial leverage, reflects the ability of equity to cover outstanding debts in the event of a business downturn. |
Neutral |
|
Exchange:
ETF
|
|
|
Sector:
Financial Services
|
|
|
Industry:
Asset Management
|
|
| Shares Out | 0 (M) |
| Shares Float | 0 (M) |
| Held by Insiders | 0 (%) |
| Held by Institutions | 0 (%) |
| Shares Short | 0 (K) |
| Shares Short P.Month | 0 (K) |
| EPS | 0 |
| EPS Est Next Qtrly | 0 |
| EPS Est This Year | 0 |
| EPS Est Next Year | 0 |
| Book Value (p.s.) | 0 |
| Profit Margin | 0 % |
| Operating Margin | 0 % |
| Return on Assets (ttm) | 0 % |
| Return on Equity (ttm) | 0 % |
| Qtrly Rev. Growth | 0 % |
| Gross Profit (p.s.) | 0 |
| Sales Per Share | 0 |
| EBITDA (p.s.) | 0 |
| Qtrly Earnings Growth | 0 % |
| Operating Cash Flow | 0 (M) |
| Levered Free Cash Flow | 0 (M) |
| PE Ratio | 0 |
| PEG Ratio | 0 |
| Price to Book value | 0 |
| Price to Sales | 0 |
| Price to Cash Flow | 0 |
| Dividend | 0 |
| Forward Dividend | 0 |
| Dividend Yield | 0% |
| Dividend Pay Date | Invalid DateTime. |
| Ex-Dividend Date | Invalid DateTime. |

|

|
|

|
|
|
|
|
|