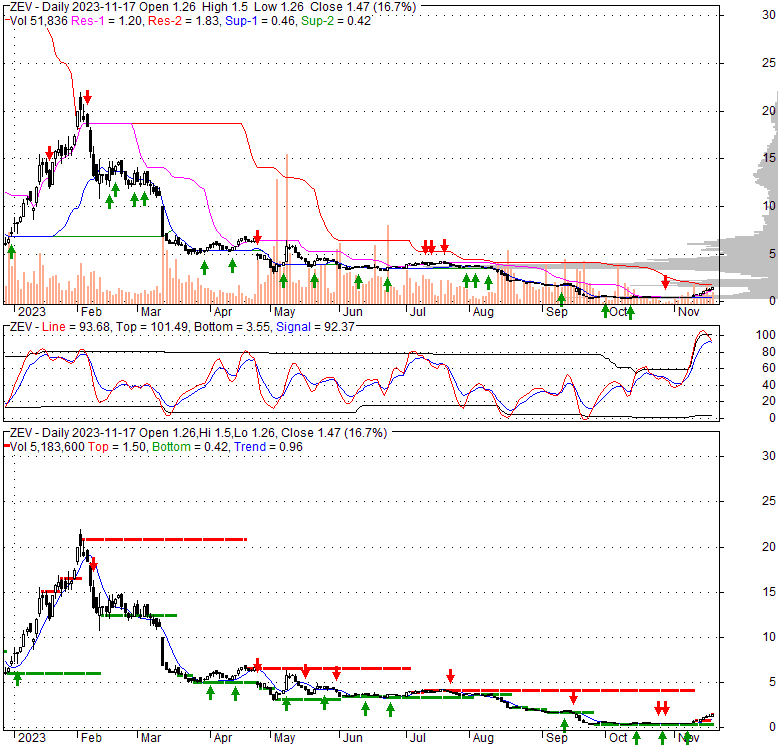
| 1.63 -0.09 (-5.23%) | 09-18 16:00 | |||||||||||||
|
|
| Short term | |
|||
| Mid term | |
|||
| Targets | 6-month : | 1.78 | 1-year : | 2.08 |
| Resists | First : | 1.52 | Second : | 1.78 |
| Pivot price | 0.74 |
|||
| Supports | First : | 0.8 | Second : | 0.36 |
| MAs | MA(5) : | 1.17 |
MA(20) : | 0.67 |
| MA(100) : | 1.96 |
MA(250) : | 5.92 |
|
| MACD | MACD : | 0.1 |
Signal : | 0 |
| %K %D | K(14,3) : | 79.6 |
D(3) : | 80.3 |
| RSI | RSI(14): 81.3 |
|||
| 52-week | High : | 22 | Low : | 0.32 |
Price has closed above its short-term moving average. Short-term moving average is currently above mid-term; and below long-term moving average. From the relationship between price and moving averages: This stock is BULLISH in short-term; and NEUTRAL in mid-long term.[ ZEV ] has closed above the upper band by 4.0%. If price is in a uptrend band; this upward trend in price might continue. However a short term pullback inside the band is likely.Bollinger Bands are 41.5% wider than normal. The large width of the bands suggest high volatility as compared to its normal range. The bands have been in this wide range for 0 days. This is a sign that the current trend might continue.
| If tomorrow: | Open lower | Open higher |
| High: | 1.5 - 1.51 | 1.51 - 1.51 |
| Low: | 1.25 - 1.25 | 1.25 - 1.26 |
| Close: | 1.46 - 1.47 | 1.47 - 1.48 |
Lightning eMotors, Inc. designs, manufactures, and sells zero-emission commercial fleet vehicles and powertrains to commercial fleets, large enterprises, original equipment manufacturers, and governments in the United States. It offers zero-emission class 3 to 7 battery electric and fuel cell electric vehicles. The company's vehicles comprise cargo and passenger vehicles, school buses, ambulances, shuttle buses, work trucks, city buses, and motorcoaches. It also offers charging systems and charging infrastructure solutions for commercial medium duty vans and motorcoach fleets. The company was founded in 2008 and is headquartered in Loveland, Colorado.
Fri, 12 Apr 2024
When Will Lightning eMotors, Inc. (NYSE:ZEV) Become Profitable? - Yahoo Movies Canada
Mon, 29 Jan 2024
LIGHTNING EMOTORS ALERT: Bragar Eagel & Squire, P.C. is Investigating Lightning eMotors Inc. on Behalf of Long ... - GlobeNewswire
Thu, 19 Oct 2023
NYSE delists Lightning eMotors; trading moved to OTC – BizWest - BizWest
Tue, 05 Sep 2023
Lightning receives notice of potential delisting from NYSE – BizWest - BizWest
Thu, 31 Aug 2023
Lightning eMotors SPAC Deal Insiders Allegedly Harmed Company - Bloomberg Law
Tue, 15 Aug 2023
Lightning eMotors, Inc. (NYSE:ZEV) Might Not Be As Mispriced As It Looks - Yahoo Finance
| Price to Book Value: P/BV, a ratio used to compare book value to its current market price, to gauge whether a stock is valued properly. |
Underperform |
| Price to Earnings: PE, the ratio for valuing a company that measures its current share price relative to its earnings per share (EPS). |
Underperform |
| Discounted cash flow: DCF, a valuation method used to estimate the value of an investment based on its expected future cash flows. |
Neutral |
| Return on Assets: ROA, indicates how profitable a company is in relation to its total assets, how efficiently uses assets to generate a profit. |
Underperform |
| Return on Equity: ROE, a measure of financial performance calculated by dividing net income by equity. a gauge of profitability and efficiency. |
Underperform |
| Debt to Equity: evaluate financial leverage, reflects the ability of equity to cover outstanding debts in the event of a business downturn. |
Outperform |

|
Exchange:
NYSE
|
|
|
Sector:
Industrials
|
|
|
Industry:
Agricultural - Machinery
|
|
| Shares Out | 6 (M) |
| Shares Float | 5 (M) |
| Held by Insiders | 26.5 (%) |
| Held by Institutions | 10.9 (%) |
| Shares Short | 442 (K) |
| Shares Short P.Month | 306 (K) |
| EPS | -9.9 |
| EPS Est Next Qtrly | 0 |
| EPS Est This Year | 0 |
| EPS Est Next Year | 0 |
| Book Value (p.s.) | 3.73 |
| Profit Margin | -221.6 % |
| Operating Margin | -343.2 % |
| Return on Assets (ttm) | -36.3 % |
| Return on Equity (ttm) | -144.8 % |
| Qtrly Rev. Growth | 123.9 % |
| Gross Profit (p.s.) | -1.84 |
| Sales Per Share | 3.82 |
| EBITDA (p.s.) | -12.77 |
| Qtrly Earnings Growth | 0 % |
| Operating Cash Flow | -109 (M) |
| Levered Free Cash Flow | -82 (M) |
| PE Ratio | -0.15 |
| PEG Ratio | 0 |
| Price to Book value | 0.39 |
| Price to Sales | 0.38 |
| Price to Cash Flow | -0.09 |
| Dividend | 0 |
| Forward Dividend | 0 |
| Dividend Yield | 0% |
| Dividend Pay Date | Invalid DateTime. |
| Ex-Dividend Date | Invalid DateTime. |