| 126.38 1.14 (0.91%) | 05-09 13:33 | |||||||||||||
|
|
| Short term | ||||
| Mid term | ||||
| Targets | 6-month : | 150.77 |
1-year : | 153.75 |
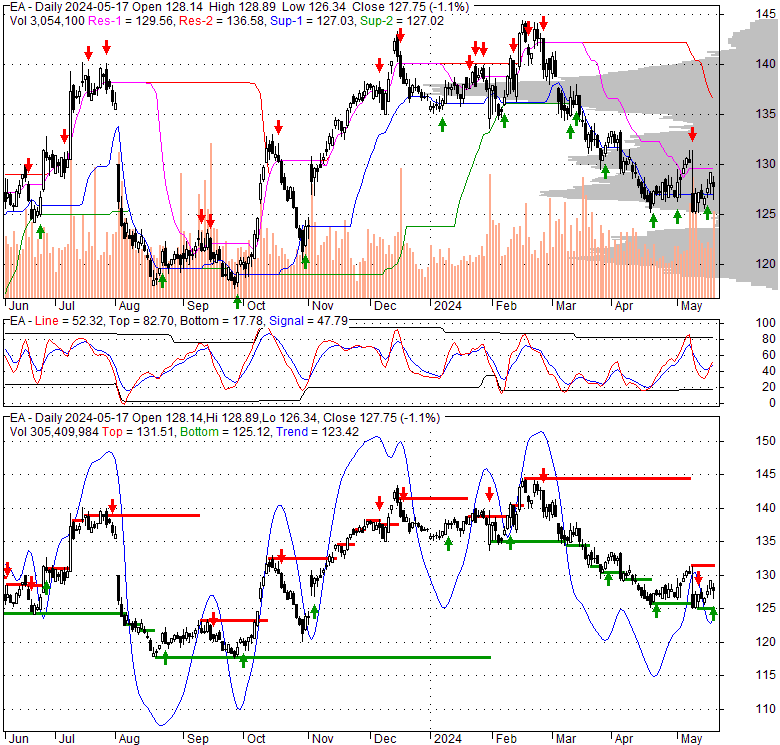
| Resists | First : | 129.08 |
Second : | 131.63 |
| Pivot price | 127.88 |
|||
| Supports | First : | 124.95 |
Second : | 103.96 |
| MAs | MA(5) : | 128.4 |
MA(20) : | 127.58 |
| MA(100) : | 134.76 |
MA(250) : | 130.67 |
|
| MACD | MACD : | -0.9 |
Signal : | -1.1 |
| %K %D | K(14,3) : | 35 |
D(3) : | 60.2 |
| RSI | RSI(14): 41.2 |
|||
| 52-week | High : | 144.52 | Low : | 117.47 |
Price has closed below its short-term moving average. Short-term moving average is currently below mid-term; and below long-term moving average. From the relationship between price and moving averages: This stock is BEARISH in short-term; and BEARISH in mid-long term.[ EA ] has closed above bottom band by 23.4%. Bollinger Bands are 17.5% narrower than normal. The current width of the bands does not suggest anything about the future direction or movement of prices.
| If tomorrow: | Open lower | Open higher |
| High: | 131.65 - 132.36 | 132.36 - 132.96 |
| Low: | 123.37 - 124.24 | 124.24 - 124.97 |
| Close: | 123.92 - 125.26 | 125.26 - 126.36 |
Electronic Arts Inc. develops, markets, publishes, and distributes games, content, and services for game consoles, PCs, mobile phones, and tablets worldwide. It develops and publishes games and services across various genres, such as sports, racing, first-person shooter, action, role-playing, and simulation primarily under the Battlefield, The Sims, Apex Legends, Need for Speed, and license games from others, including FIFA, Madden NFL, UFC, and Star Wars brands. The company licenses its games to third parties to distribute and host its games. It markets and sells its games and services through digital distribution and retail channels, as well as directly to mass market retailers, specialty stores, and distribution arrangements. Electronic Arts Inc. was incorporated in 1982 and is headquartered in Redwood City, California.
Thu, 09 May 2024
Electronic Arts Q2 Earnings: Engaging Players, Boosting Value - MarketBeat
Wed, 08 May 2024
Electronic Arts Inc. (NASDAQ:EA) Q4 2024 Earnings Call Transcript - Yahoo Finance
Wed, 08 May 2024
Electronic Arts Inc (EA) (Q4 2024) Earnings Call Transcript Highlights: Strategic Insights and Financial Outcomes - GuruFocus.com
Tue, 07 May 2024
Compared to Estimates, Electronic Arts (EA) Q4 Earnings: A Look at Key Metrics - Yahoo Finance
Tue, 07 May 2024
Electronic Arts Inc (EA) Reports Fiscal Year 2024 Earnings, Aligns with Analyst Projections - GuruFocus.com
Tue, 07 May 2024
Electronic Arts Reports Q4 and FY24 Results - Business Wire
| Price to Book Value: P/BV, a ratio used to compare book value to its current market price, to gauge whether a stock is valued properly. |
Outperform |
| Price to Earnings: PE, the ratio for valuing a company that measures its current share price relative to its earnings per share (EPS). |
Outperform |
| Discounted cash flow: DCF, a valuation method used to estimate the value of an investment based on its expected future cash flows. |
Outperform |
| Return on Assets: ROA, indicates how profitable a company is in relation to its total assets, how efficiently uses assets to generate a profit. |
Outperform |
| Return on Equity: ROE, a measure of financial performance calculated by dividing net income by equity. a gauge of profitability and efficiency. |
Outperform |
| Debt to Equity: evaluate financial leverage, reflects the ability of equity to cover outstanding debts in the event of a business downturn. |
Outperform |
|
Exchange:
NASDAQ
|
|
|
Sector:
Technology
|
|
|
Industry:
Electronic Gaming & Multimedia
|
|
| Shares Out | 267 (M) |
| Shares Float | 242 (M) |
| Held by Insiders | 0.3 (%) |
| Held by Institutions | 96.7 (%) |
| Shares Short | 6,890 (K) |
| Shares Short P.Month | 6,950 (K) |
| EPS | 3.96 |
| EPS Est Next Qtrly | 0 |
| EPS Est This Year | 0 |
| EPS Est Next Year | 0 |
| Book Value (p.s.) | 28.09 |
| Profit Margin | 14 % |
| Operating Margin | 18.7 % |
| Return on Assets (ttm) | 7.2 % |
| Return on Equity (ttm) | 14.3 % |
| Qtrly Rev. Growth | 3.4 % |
| Gross Profit (p.s.) | 0 |
| Sales Per Share | 28.65 |
| EBITDA (p.s.) | 7.21 |
| Qtrly Earnings Growth | 46.5 % |
| Operating Cash Flow | 2,350 (M) |
| Levered Free Cash Flow | 1,900 (M) |
| PE Ratio | 31.92 |
| PEG Ratio | 1.4 |
| Price to Book value | 4.5 |
| Price to Sales | 4.41 |
| Price to Cash Flow | 14.38 |
| Dividend | 0.18 |
| Forward Dividend | 0 |
| Dividend Yield | 0.1% |
| Dividend Pay Date | Invalid DateTime. |
| Ex-Dividend Date | Invalid DateTime. |

|

|
|

|
|
|
|
|
|