
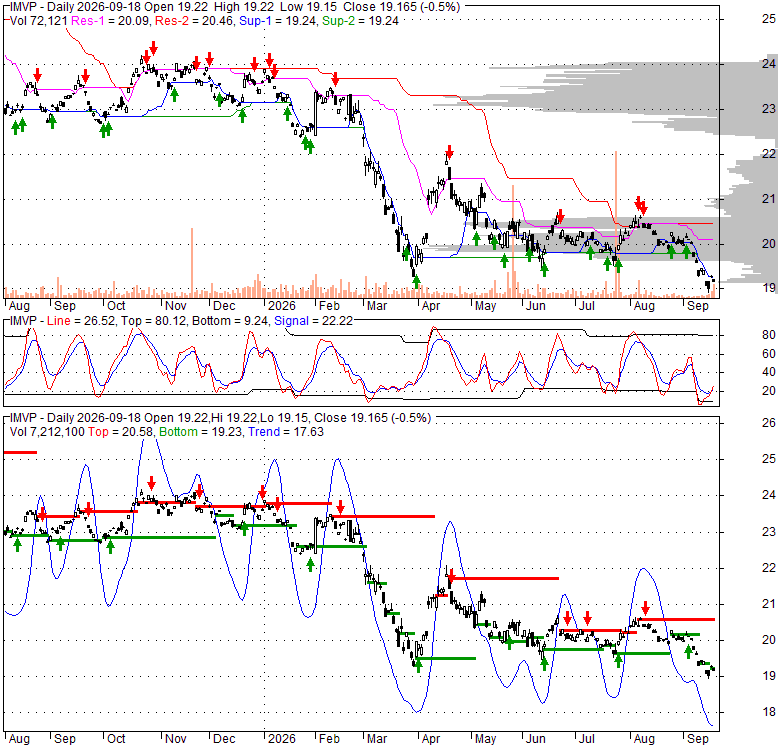
| 19.17 -0.099 (-0.52%) | 09-18 15:59 | |||||||||||||
|
|
| Short term |  |
|||
| Mid term |  |
|||
| Targets | 6-month : | 23.11  |
1-year : | 23.74 |
| Resists | First : | 19.78 |
Second : | 20.32 |
| Pivot price | 19.62 |
|||
| Supports | First : | 18.9 | Second : | 15.73 |
| MAs | MA(5) : | 19.18 |
MA(20) : | 19.73 |
| MA(100) : | 20.12 |
MA(250) : | 21.65 |
|
| MACD | MACD : | -0.3 |
Signal : | -0.2 |
| %K %D | K(14,3) : | 17.8  |
D(3) : | 12.3 |
| RSI | RSI(14): 35.1 |
|||
| 52-week | High : | 24.21 | Low : | 18.9 |
Price has closed below its short-term moving average. Short-term moving average is currently below mid-term; and below long-term moving average. From the relationship between price and moving averages: This stock is BEARISH in short-term; and BEARISH in mid-long term.[ IMVP ] has closed above bottom band by 21.0%. Bollinger Bands are 72.4% wider than normal. The large width of the bands suggest high volatility as compared to its normal range. The bands have been in this wide range for 3 days. This is a sign that the current trend might continue.
| If tomorrow: | Open lower | Open higher |
| High: | 19.27 - 19.38 | 19.38 - 19.47 |
| Low: | 18.81 - 18.97 | 18.97 - 19.09 |
| Close: | 18.94 - 19.17 | 19.17 - 19.35 |
Effective around February 23, 2026, the Invesco India ETF (IMVP) will adjust its core investment methodology. From this date forward, the fund intends to allocate a minimum of 90% of its total capital to securities that make up its newly adopted underlying index, including both direct equity holdings and their corresponding American or Global Depositary Receipts (ADRs/GDRs). The fund's overarching goal is to achieve extensive coverage of the Indian stock market by mirroring an index that systematically filters out underperforming companies. This index starts by considering all stocks listed on the National Stock Exchange of India. It then applies a two-step screening process: 1. Yield Filter: Stocks are ranked by their dividend yield over the preceding 12 months, and the lowest-yielding 10% are eliminated. 2. Quality Filter: Subsequently, the remaining stocks are assessed for "quality." This metric combines profitability indicators (such as return on assets, asset turnover, and accruals) with the company's leverage ratio. The bottom 10% based on this quality assessment are then removed. A specific rule applies to financial firms, for which only Return on Assets is utilized in the quality evaluation. The resulting constituents are weighted based on their market capitalization, subject to specific concentration limits. The largest individual holding is capped at 10%, the second largest at 9%, and this decreasing cap continues for the top six holdings. Furthermore, the combined weight of all individual positions exceeding 5% is restricted to a maximum of 40%. The index's composition undergoes a re-evaluation twice a year. Historical Note: Prior to June 24, 2019, the fund tracked the Indus India Index, which utilized different screening mechanisms.
Thu, 10 Sep 2026
IMVP - Invesco India ETF Forecast, Target Price - Finviz
Sun, 12 Jul 2026
Asian stock leadership shifts as AI-fueled rally shows signs of fatigue, SocGen says (EWJ:NYSEARCA) - Seeking Alpha
Sat, 30 May 2026
IMVP - Invesco India ETF Stock Price and Quote - Finviz
Mon, 25 May 2026
IMVP: Better To Avoid Allocation To This ETF For Present - Seeking Alpha
Wed, 11 Feb 2026
GLIN: GARP Approach On The EU-India Trade Agreement (NYSEARCA:GLIN) - Seeking Alpha
| Price to Book Value: P/BV, a ratio used to compare book value to its current market price, to gauge whether a stock is valued properly. |
Neutral |
| Price to Earnings: PE, the ratio for valuing a company that measures its current share price relative to its earnings per share (EPS). |
Neutral |
| Discounted cash flow: DCF, a valuation method used to estimate the value of an investment based on its expected future cash flows. |
Neutral |
| Return on Assets: ROA, indicates how profitable a company is in relation to its total assets, how efficiently uses assets to generate a profit. |
Neutral |
| Return on Equity: ROE, a measure of financial performance calculated by dividing net income by equity. a gauge of profitability and efficiency. |
Neutral |
| Debt to Equity: evaluate financial leverage, reflects the ability of equity to cover outstanding debts in the event of a business downturn. |
Neutral |
|
Exchange:
AMEX
|
|
|
Sector:
Financial Services
|
|
|
Industry:
Asset Management - Global
|
|
| Shares Out | 0 (M) |
| Shares Float | 0 (M) |
| Held by Insiders | 0 (%) |
| Held by Institutions | 0 (%) |
| Shares Short | 0 (K) |
| Shares Short P.Month | 0 (K) |
| EPS | 0 |
| EPS Est Next Qtrly | 0 |
| EPS Est This Year | 0 |
| EPS Est Next Year | 0 |
| Book Value (p.s.) | 0 |
| Profit Margin | 0 % |
| Operating Margin | 0 % |
| Return on Assets (ttm) | 0 % |
| Return on Equity (ttm) | 0 % |
| Qtrly Rev. Growth | 0 % |
| Gross Profit (p.s.) | 0 |
| Sales Per Share | 0 |
| EBITDA (p.s.) | 0 |
| Qtrly Earnings Growth | 0 % |
| Operating Cash Flow | 0 (M) |
| Levered Free Cash Flow | 0 (M) |
| PE Ratio | 0 |
| PEG Ratio | 0 |
| Price to Book value | 0 |
| Price to Sales | 0 |
| Price to Cash Flow | 0 |
| Dividend | 0 |
| Forward Dividend | 0 |
| Dividend Yield | 0% |
| Dividend Pay Date | Invalid DateTime. |
| Ex-Dividend Date | Invalid DateTime. |

|

|
|

|
|
|
|
|
|