|
Accumulation/Distribution Line
A
momentum indicator that relates price changes with volume on the
assumption that the more significant the volume, the more significant the
price move.
The
Accumulation/Distribution Line has been one of the most popular volume
indicators over the years . volume precedes price. Volume reflects the
amount of shares traded in a particular stock, and is a direct reflection
of the money flowing into and out of a stock. The
Accumulation/Distribution Line was developed by Marc Chaikin to assess the
cumulative flow of money into and out of a security. It is a momentum indicator which takes into account
changes in price and volume together. The idea is that a change in price
coupled with an increase in volume may help to confirm market momentum in
the direction of the price move.
Accumulation/Distribution Line formula
A
portion of daily volume is added or subtracted from a cumulative total.
More volume is added the nearer the close to the high for the day and more
subtracted the nearer the close to the low. Nothing is added or subtracted
when the close is equidistant between the day's high and low.
The
Accumulation/Distribution Line formula is as follows:
Acc/Dist = ((Close – Low) – (High – Close)) / (High – Low) * Period's
volume
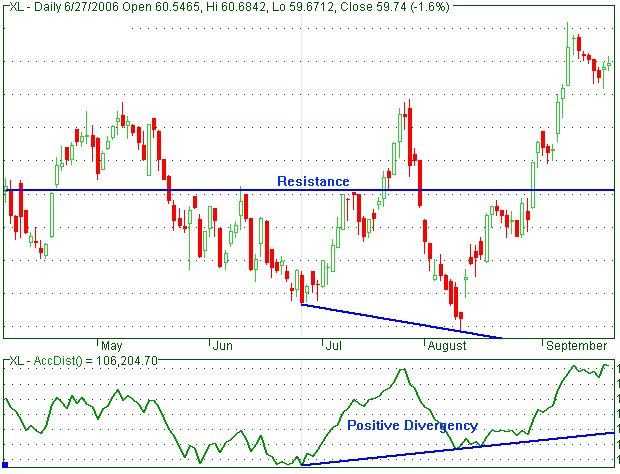
Bullish Signals
Positive Divergence
A
bullish signal is given when the Accumulation/Distribution Line forms a
positive divergence, which
means that the A/D line is trending upward while the price is trending
downward. For example, if the accumulation/distribution line is moving
up and the price of the stock is falling then the price is likely to
reverse.
Moving up
When the accumulation/distribution line is
moving up it depicts buying
(accumulation), which should
eventually lead to price increases. In an advance, the
Accumulation/Distribution Line should keep up or, move in an uptrend.
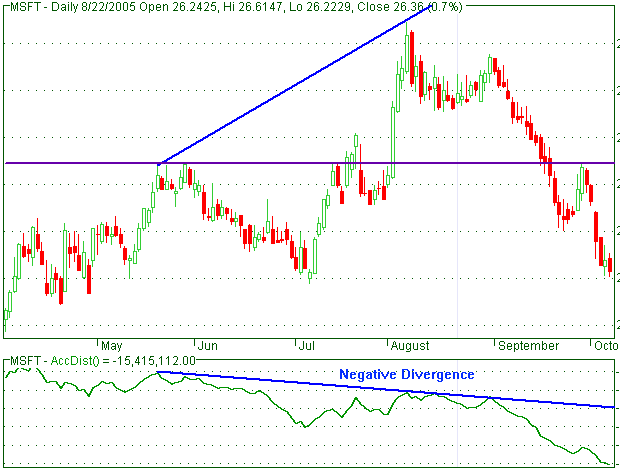
Bearish Signals
Negative divergence
A
bearish signal is given when the Accumulation/Distribution Line forms a
negative divergence, which means that the A/D line is trending
downward while the price is trending upward. For example, if the
accumulation/distribution line is moving down and the price of the stock
is rising then the price is likely to reverse.
Moving down
When the accumulation/distribution line is
moving down it depicts selling (distribution), which should eventually
lead to price decreases. In a decline, the Accumulation/Distribution
Line should keep down or, move in a downtrend.
 |


