|
New Page 2
The Elliott wave
principle
The Elliott wave
principle is a form of technical analysis that attempts to forecast trends
in the financial markets and other collective activities. It is named
after Ralph Nelson Elliott (1871–1948), an accountant who developed the
concept in the 1930s: he proposed that market prices unfold in specific
patterns, which practitioners today call Elliott waves. Elliott published
his views of market behavior in the book The Wave Principle (1938), in a
series of articles in Financial World magazine in 1939, and most fully in
his final major work, Nature’s Laws – The Secret of the Universe (1946).
Elliott argued that because humans are themselves rhythmical, their
activities and decisions could be predicted in rhythms, too. Critics argue
the theory is un-provable and inconsistent with the efficient market
hypothesis.
Overall design
The wave principle posits that collective investor psychology (or crowd
psychology) moves from optimism to pessimism and back again. These swings
create patterns, as evidenced in the price movements of a market at every
degree of trend.
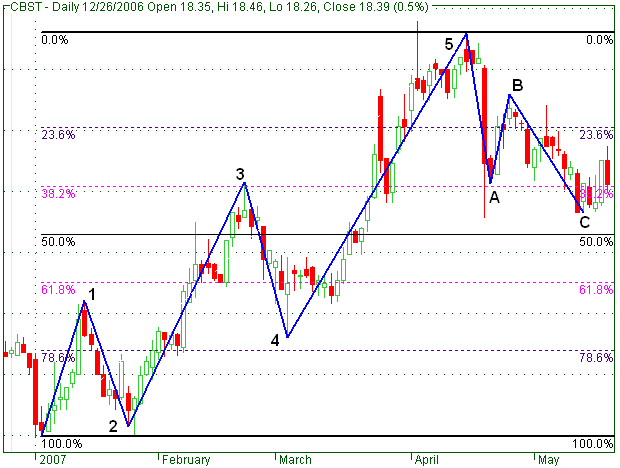
From R.N. Elliott's essay, "The Basis of the Wave Principle," October
1940.Elliott's model says that market prices alternate between five waves
and three waves at all degrees of trend, as the illustration shows. As
these waves develop, the larger price patterns unfold in a self-similar
fractal geometry. Within the dominant trend, waves 1, 3, and 5 are
"motive" waves, and each motive wave itself subdivides in five waves.
Waves 2 and 4 are "corrective" waves, and subdivide in three waves. In a
bear market the dominant trend is downward, so the pattern is
reversed—five waves down and three up. Motive waves always move with the
trend, while corrective waves move against it.
Degree
The patterns link to form five and three-wave structures of increasing
size or "degree." Note the lowest of the three idealized cycles. In the
first small five-wave sequence, waves 1, 3 and 5 are motive, while waves 2
and 4 are corrective. This signals that the movement of one larger degree
is upward. It also signals the start of the first small three-wave
corrective sequence. After the initial five waves up and three waves down,
the sequence begins again and the self-similar fractal geometry begins to
unfold. The completed motive pattern includes 89 waves, followed by a
completed corrective pattern of 55 waves.
Each degree of the pattern in a financial market has a name. Practitioners
use symbols for each wave to indicate both function and degree—numbers for
motive waves, letters for corrective waves (shown in the highest of the
three idealized cycles). Degrees are relative; they are defined by form,
not by absolute size or duration. Waves of the same degree may be of very
different size and/or duration.
The classification of a wave at any particular degree can vary, though
practitioners generally agree on the standard order of degrees
(approximate durations given):
Grand supercycle:
multi-decade to multi-century
Supercycle:
a few years to a few decades
Cycle: one year to a few years
Primary: a few months to a couple of
years
Intermediate: weeks to months
Minor: weeks
Minute: days
Minuette: hours
Subminuette: minutes
Behavioral characteristics and wave "signature"
Elliott Wave analysts (or "Elliotticians") hold that it is not necessary
to look at a price chart to judge where a market is in its wave pattern.
Each wave has its own "signature" which often reflects the psychology of
the moment. Understanding how and why the waves develop is key to the
application of the Wave Principle; that understanding includes recognizing
the characteristics described below.
These wave characteristics assume a bull market in equities. The
characteristics apply in reverse in bear markets.
|
Five wave pattern
(dominant trend) |
Three wave
pattern (corrective trend) |
|
Wave 1:
Wave one is rarely obvious at its inception. When the first wave of
a new bull market begins, the fundamental news is almost universally
negative. The previous trend is considered still strongly in force.
Fundamental analysts continue to revise their earnings estimates
lower; the economy probably does not look strong. Sentiment surveys
are decidedly bearish, put options are in vogue, and implied
volatility in the options market is high. Volume might increase a
bit as prices rise, but not by enough to alert many technical
analysts. |
Wave A:
Corrections are typically harder to identify than impulse moves. In
wave A of a bear market, the fundamental news is usually still
positive. Most analysts see the drop as a correction in a
still-active bull market. Some technical indicators that accompany
wave A include increased volume, rising implied volatility in the
options markets and possibly a turn higher in open interest in
related futures markets. |
|
Wave 2:
Wave two corrects wave one, but can never extend beyond the starting
point of wave one. Typically, the news is still bad. As prices
retest the prior low, bearish sentiment quickly builds, and "the
crowd" haughtily reminds all that the bear market is still deeply
ensconced. Still, some positive signs appear for those who are
looking: volume should be lower during wave two than during wave
one, prices usually do not retrace more than 61.8% (see Fibonacci
section below) of the wave one gains, and prices should fall in a
three wave pattern. |
Wave B:
Prices reverse higher, which many see as a resumption of the now
long-gone bull market. Those familiar with classical technical
analysis may see the peak as the right shoulder of a head and
shoulders reversal pattern. The volume during wave B should be lower
than in wave A. By this point, fundamentals are probably no longer
improving, but they most likely have not yet turned negative. |
|
Wave 3:
Wave three is usually the largest and most powerful wave in a trend
(although some research suggests that in commodity markets, wave
five is the largest). The news is now positive and fundamental
analysts start to raise earnings estimates. Prices rise quickly,
corrections are short-lived and shallow. Anyone looking to "get in
on a pullback" will likely miss the boat. As wave three starts, the
news is probably still bearish, and most market players remain
negative; but by wave three's midpoint, "the crowd" will often join
the new bullish trend. Wave three often extends wave one by a ratio
of 1.618:1. |
Wave C:
Prices move impulsively lower in five waves. Volume picks up, and by
the third leg of wave C, almost everyone realizes that a bear market
is firmly entrenched. Wave C is typically at least as large as wave
A and often extends to 1.618 times wave A or beyond. |
|
Wave 4:
Wave four is typically clearly corrective. Prices may meander
sideways for an extended period, and wave four typically retraces
less than 38.2% of wave three. Volume is well below than that of
wave three. This is a good place to buy a pull back if you
understand the potential ahead for wave 5. Still, the most
distinguishing feature of fourth waves is that they often prove very
difficult to count. |
|
|
Wave 5:
Wave five is the final leg in the direction of the dominant trend.
The news is almost universally positive and everyone is bullish.
Unfortunately, this is when many average investors finally buy in,
right before the top. Volume is lower in wave five than in wave
three, and many momentum indicators start to show divergences
(prices reach a new high, the indicator does not reach a new peak).
At the end of a major bull market, bears may very well be ridiculed
(recall how forecasts for a top in the stock market during 2000 were
received). |
|
Fibonacci relationships
R. N. Elliott's analysis of the mathematical properties of waves and
patterns eventually led him to conclude that "The Fibonacci Summation
Series is the basis of The Wave Principle."[1] Numbers from the Fibonacci
sequence surface repeatedly in Elliott wave structures, including motive
waves (1, 3, 5), a single full cycle (5 up, 3 down = 8 waves), and the
completed motive (89 waves) and corrective (55 waves) patterns. Elliott
developed his market model before he realized that it reflects the
Fibonacci sequence. "When I discovered The Wave Principle action of market
trends, I had never heard of either the Fibonacci Series or the
Pythagorean Diagram."
The Fibonacci sequence is also closely connected to the Golden ratio
(1.618). Practitioners commonly use this ratio and related ratios to
establish support and resistance levels for market waves, namely the price
points which help define the parameters of a trend.
Finance professor Roy Batchelor and researcher Richard Ramyar studied
whether Fibonacci ratios appear non-randomly in the stock market, as
Elliott's model predicts. The researchers said the "idea that prices
retrace to a Fibonacci ratio or round fraction of the previous trend
clearly lacks any scientific rationale." They also said "there is no
significant difference between the frequencies with which price and time
ratios occur in cycles in the Dow Jones Industrial Average, and
frequencies which we would expect to occur at random in such a time
series."
Robert Prechter replied to the Batchelor-Ramyar study, saying that it
"does not challenge the validity of any aspect of the Wave Principle...it
supports wave theorists' observations." The Socionomics Institute also
reviewed data in the Batchelor-Ramyar study, and said this data shows
"Fibonacci ratios do occur more often in the stock market than would be
expected in a random environment." |


