|
New Page 2
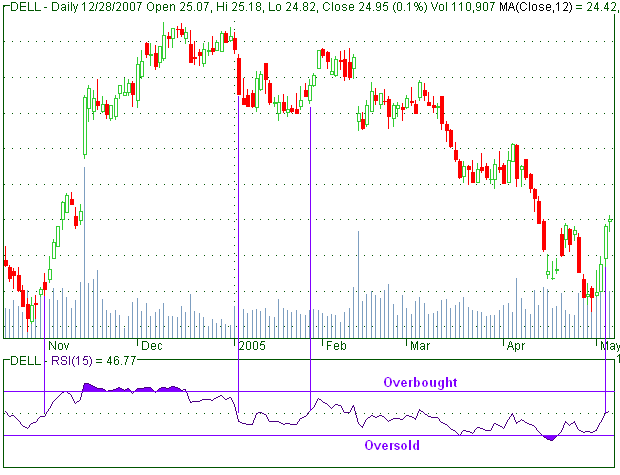
Relative
strength index
The Relative Strength Index (RSI) is a financial technical
analysis oscillator showing price strength by comparing upward and downward
close-to-close movements.
The RSI is popular because it is relatively easy to interpret. It was
developed by J. Welles Wilder and published in Commodities magazine (now
called Futures magazine) in June 1978, and in his New Concepts in Technical
Trading Systems the same year.
Calculation
RSI = 100 - 100 / (1 + RS)
RS = Average Gain / Average Loss
Average Gain = [(previous Average Gain) x 13 + current Gain] / 14
First Average Gain = Total of Gains during past 14 periods / 14
Average Loss = [(previous Average Loss) x 13 + current Loss] / 14
First Average Loss = Total of Losses during past 14 periods / 14
Note: "Losses" are reported as positive values.
How To
Use
Overbought/Oversold
Using 70 and 30 as overbought and oversold levels respectively. Generally,
if the RSI rises above 30 it is considered bullish for the underlying stock.
Conversely, if the RSI falls below 70, it is a bearish signal.
Go long when RSI falls
below the 30 level and rises back above it
Go short when RSI rises above the 70 level and
falls back below it
Divergences
Buy and sell signals can also be generated by looking for positive and
negative divergences between the RSI and the underlying stock. For example,
consider a falling stock whose RSI rises from a low point back up to a high
point. Because of how the RSI is calculated, the underlying stock will often
reverse its direction soon after such a divergence. As in that example,
divergences that occur after an overbought or oversold reading usually
provide more reliable signals.
Go long on a positive divergence where the
first trough is below 30.
Go short on a negative divergence where the first peak is above 70.
Centerline Crossover
The centerline for RSI is 50. Readings above and below can give the
indicator a bullish or bearish tilt. On the whole, a reading above 50
indicates that average gains are higher than average losses and a reading
below 50 indicates that losses are winning the battle. Some traders look for
a move above 50 to confirm bullish signals or a move below 50 to confirm
bearish signals.
|


