|
New Page 2
Stochastic
oscillator
The stochastic oscillator is a momentum indicator used in technical
analysis, introduced by George Lane in the 1950s, to compare the closing
price of a commodity to its price range over a given time span.
George
Lane, a financial analyst from the 1950s is one of the first to publish on
the use of stochastic oscillators to forecast prices. According to Lane
you use the stochastics indicator with a good knowledge of "Elliot Wave
Theory". A Center piece of his teaching is the divergence and convergence of
trend lines drawn on stochastics as diverging/converging to trend lines
drawn on price cycles. Stochastics has the power to predict tops and
bottoms.
Calculation
The Stochastic Oscillator has variables:
n periods. This is the number of time periods used in the stochastic
calculation;
%K. This value controls the internal smoothing of %K. A value of 1 is
considered a fast stochastic; a value of 3 is considered a slow stochastic;
%D. The method (i.e., Exponential, Simple, Smoothed, or Weighted) that is
used to calculate %D.
The formula for %K is:
%K = (CLOSE-LOW(n))/(HIGH(n)-LOW(n))*100
Where:
CLOSE — is today’s closing price;
LOW(n) — is the lowest low in n periods;
HIGH(n) — is the highest high in n periods.
The %D moving average is calculated according to the formula:
%D = SMA(%K, m)
Where:
m — is the smoothing period;
SMA — is the Simple Moving Average.
The usual
"n" is 14 days but this can be varied. Usually m=3. When the current closing
price is the low for the last N-days, the %K value is 0, when the current
closing price is a high for the last N-days, %K=100.
How To Use
The idea behind this indicator is that prices tend to close near their past
highs in bull markets, and near their lows in bear markets. Transaction
signals can be spotted when the stochastic oscillator crosses its moving
average.
Two stochastic oscillator indicators are typically calculated to assess
future variations in prices, a fast (%K) and slow (%D). Comparisons of these
statistics are a good indicator of speed at which prices are changing or the
Impulse of Price. %K is the same as Williams %R, though on a scale 0 to 100
instead of -100 to 0, but the terminology for the two are kept separate.
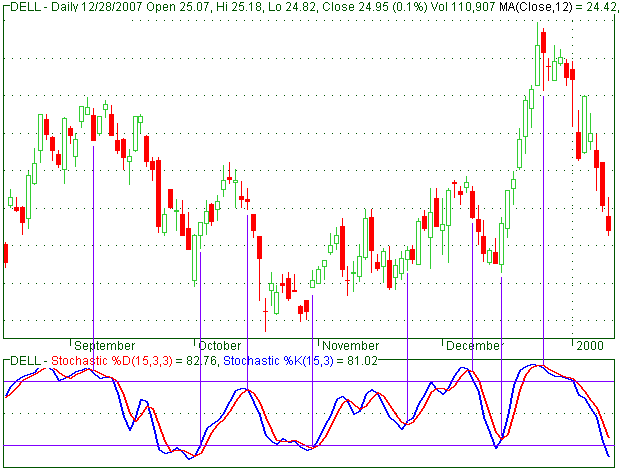
The %K and %D oscillators range from 0 to 100 and are often visualized using
a line plot. Levels near the extremes 100 and 0, for either %K or %D,
indicate strength or weakness (respectively) because prices have made or are
near new N-day highs or lows.
There are two well known methods for using the %K and %D indicators to make
decisions about when to buy or sell stocks.
1). The
first involves crossing of %K and %D signals.
%D acts as
a trigger or signal line for %K. A buy signal is given when %K crosses up
through %D, or a sell signal when it crosses down through %D. Such
crossovers can occur too often, and to avoid repeated whipsaws one can wait
for crossovers occurring together with an overbought/oversold pullback, or
only after a peak or trough in the %D line. If price volatility is high, a
simple moving average of the Stoch %D indicator may be taken. This statistic
smoothes out rapid fluctuations in price.
2). The
second involves basing buy and sell decisions on the assumption that %K and
%D oscillate.
Some analysts argue that %K or %D levels above 80 and below 20 can be
interpreted as overbought or oversold. On the theory that the prices
oscillate, many analysts recommend that buying and selling be timed to the
return from these thresholds. In other words, one should buy or sell after a
bit of a reversal. Practically, this means that once the price exceeds one
of these thresholds, the investor should wait for prices to return through
those thresholds (e.g. if the oscillator were to go above 80, the investor
waits until it falls below 80 to sell).
|


