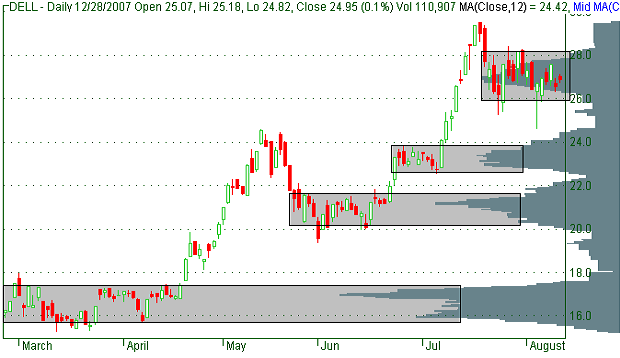
Volume At Price histogram is
also known as "Volume Profile" chart. VAP shows total volume of trading that
occurred at given price level. VAP is calculated from data bars that are
currently visible.
Actual algorithm involves not
ONE price but High-Low price RANGE.
Listen to What Volume Tells You!
There are 6 simple rules to
learn in order to interpret price and volume movements:
1. Increasing volume on
increasing price signals an acceleration in buying pressure and price
advance.
2. Increasing volume on
decreasing price signals an acceleration in selling pressure and price
decrease.
3. Decreasing volume on
increasing price indicates an easing in buying pressure and a leveling in
price or price reversal.
4. Decreasing volume on
decreasing price indicates an easing in selling pressure and a leveling in
price or price reversal.
5. Higher than normal volume at
price highs indicates selling into strength and a price ceiling.
6. Higher than normal volume at
price lows indicates buying on weakness and price support.